4D InSpec Analysis Software
Powerful and intuitive acquisition and analysis software for surface inspection with 4D InSpec gauges.
4D InSpec Measurement and Analysis Software
4D InSpec software sets the standard for easy analysis of data from surface roughness profilers. The software is designed with features that make life easy: a push-button interface, open data file format, extensive 2D and 3D displays, filtering, data masking, feature analysis, built-in robotic interface, and much more.
“Best software in the industry.”
Using the Measurement and Analysis software
The 4D InSpec software is full-featured, but easy to use. Information is presented in a clear format, and steps are included in logical groups and functions.
Acquiring measurement data is easy using the live view in 4D InSpec’s software.
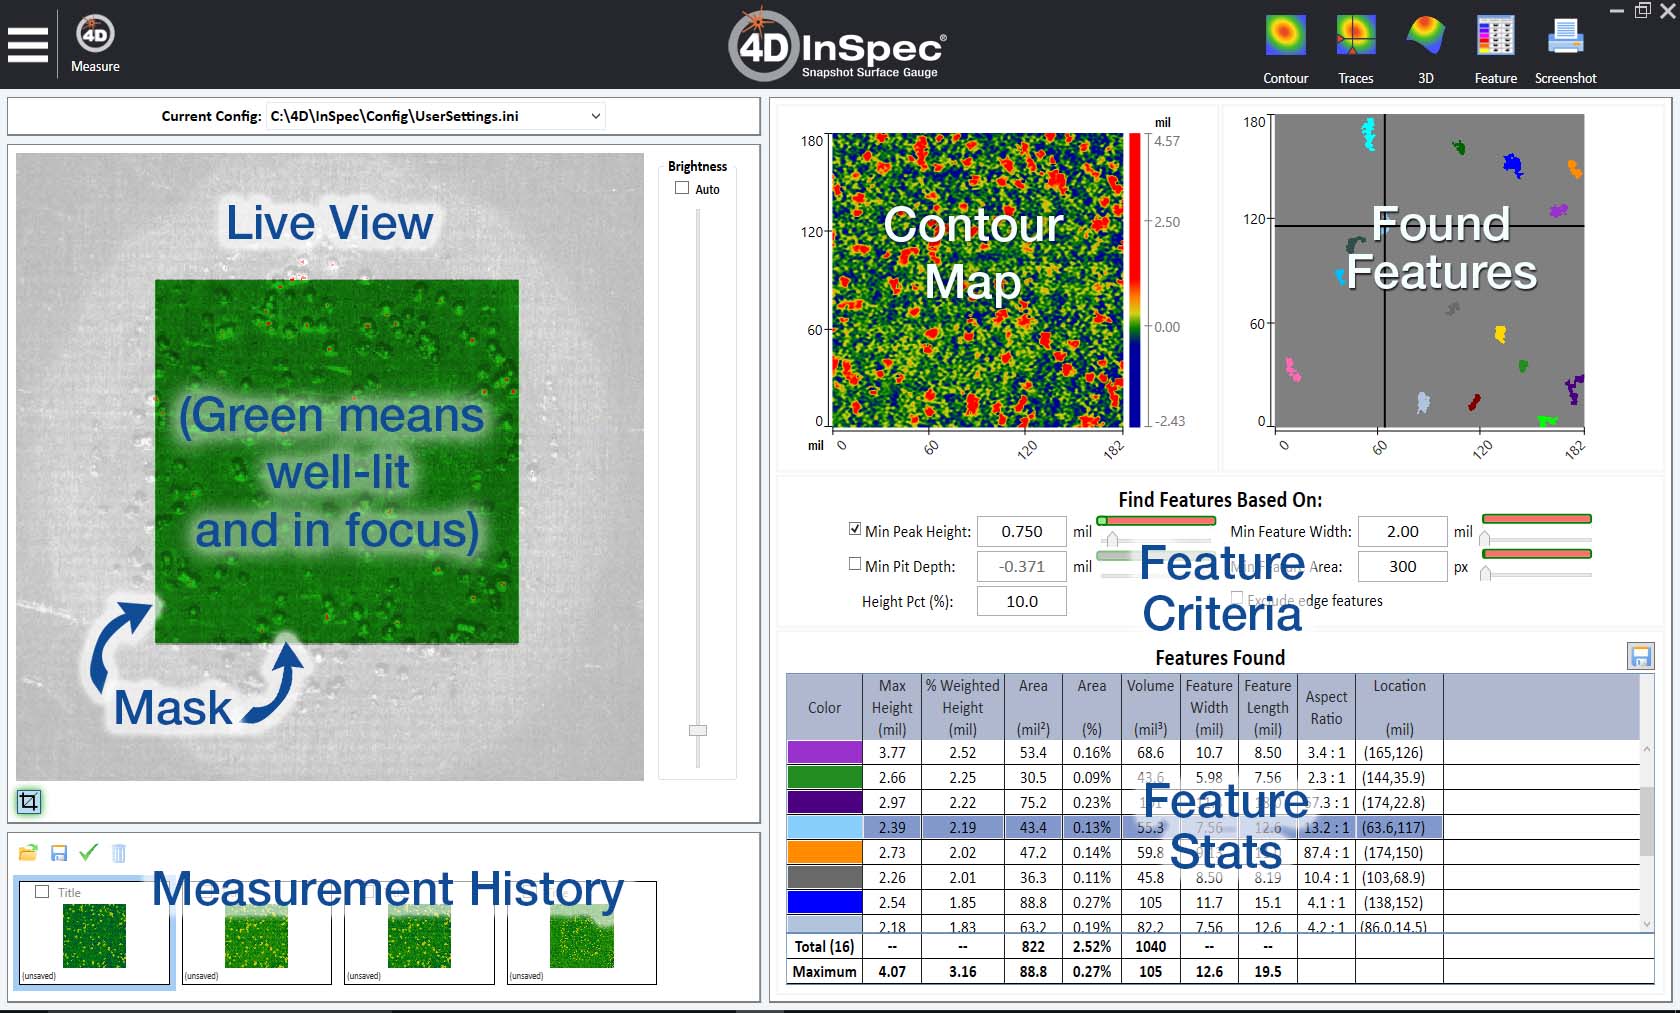
You can see what the instrument sees using real time video in the Live View area. Grey, green, yellow and red (false) colors on the screen indicate when you can obtain a good measurement. By dragging a box, you can mask the field of view to measure just in your area of interest.
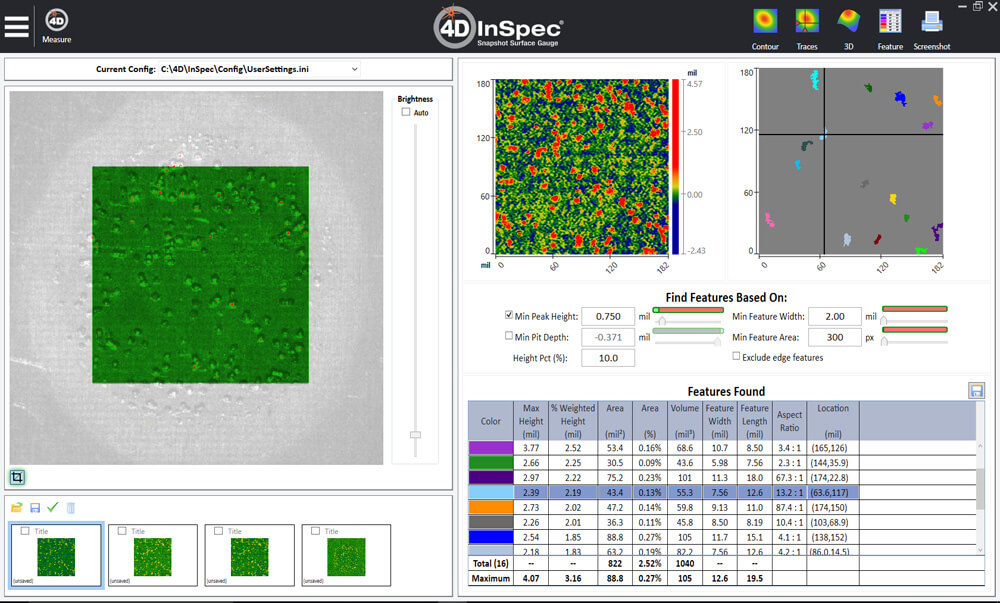
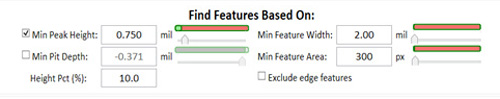
In Feature Analysis view, you can enter your feature criteria—such as minimum and maximum heights, pit depths and the minimum area of a feature—to let the software find and quantify your features. The statistical results are displayed in the Features Found table, and color coded in the Found Features plot. Features outside of your criteria are hidden.
Additional analysis
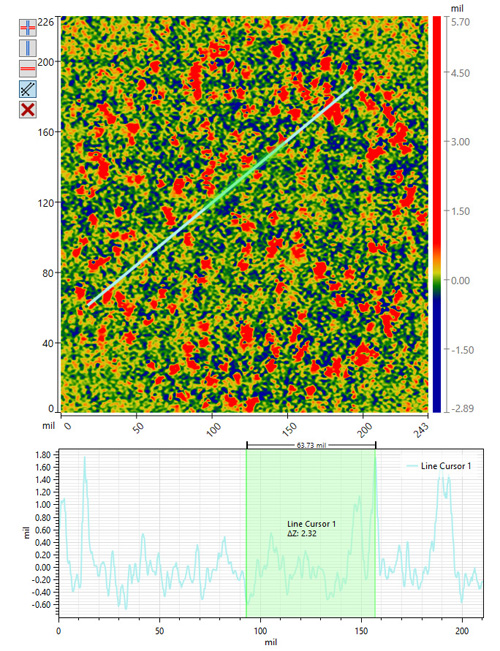
You can also show a 2D or 3D plot of the area, full screen. On a 2D or 3D plot, you can draw profiles in the X or Y direction, or using an arbitrary segment that you draw by clicking and dragging.
In the space below the area plot, the cross-sectional line profile is plotted. Within the profile, click and drag to obtain segment information, such as the change in height between the beginning and end points of the sub-segment, and the distance laterally between the end points.
Shape analysis
Other analysis tools allow for measuring a radius of curvature of a feature, such as a groove in a surface, or the radius of a cylindrical or spherical surface that was measured.
Data retention and sharing
The software keeps an image of your field of view, and the resulting measurement in the Measurement Stack until you save it. Data reports are incredibly simple. Save the entire screen, save individual plots, or export the Features Analysis data. You can also save each measurement in a variety of file types for easy export to other software.
Recipes let you choose a set of thresholds and settings for repeatable measurements over time, and between operators.
The 4D InSpec software comes supplied with the 4D InSpec Surface Gauge. The software can be purchased separately for data analysis and report generation on another desktop or laptop computer.
Remote access software lets you interface with the core functions of the instrument and software from user-written applications, by means of a Windows Communication Foundation (WCF).
Get In Touch
(520) 294-5600
Location
3280 E Hemisphere Loop, Ste 146
Tucson, AZ 85706
4Dinfo@ontoinnovation.com
Office Hours (Arizona Time)
Mon: 8am - 5pm
Tue: 8am - 5pm
Wed: 8am - 5pm
Thur: 8am - 5pm
Fri: 8am - 5pm
Sat: Closed
Sun: Closed